multilayer_witness_measured#
- esis.flights.f1.optics.gratings.materials.multilayer_witness_measured()#
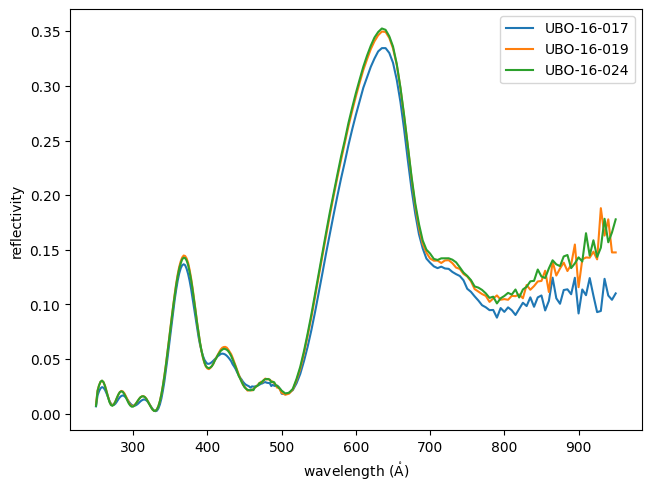
A reflectivity measurement of the witness samples associated with the ESIS diffraction gratings gathered by Eric Gullikson.
Examples
Load the measurement and plot it as a function of wavelength.
import matplotlib.pyplot as plt
import named_arrays as na
from esis.flights.f1.optics import gratings

# Load the witness sample measurements
multilayer = gratings.materials.multilayer_witness_measured()
measurement = multilayer.efficiency_measured

# Plot the measurement as a function of wavelength
fig, ax = plt.subplots(constrained_layout=True)
na.plt.plot(
    measurement.inputs.wavelength,
    measurement.outputs,
    ax=ax,
    axis="wavelength",
    label=multilayer.serial_number,
)
ax.set_xlabel(f"wavelength ({measurement.inputs.wavelength.unit:latex_inline})");
ax.set_ylabel("reflectivity");
ax.legend();
- Return type: