multilayer_design#
- esis.flights.f1.optics.gratings.materials.multilayer_design()#
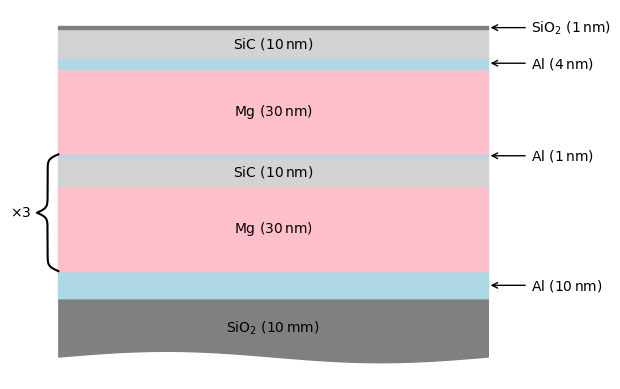
The as-designed multilayer coating for the ESIS diffraction gratings. This coating is based on the design outlined in Soufli et al. [2012].
Based on the analysis of Rebellato et al. [2018], this model uses Kortright and Windt [1988] for the silicon carbide optical constants, and Vidal-Dasilva et al. [2010] for the magnesium optical constants.
Examples
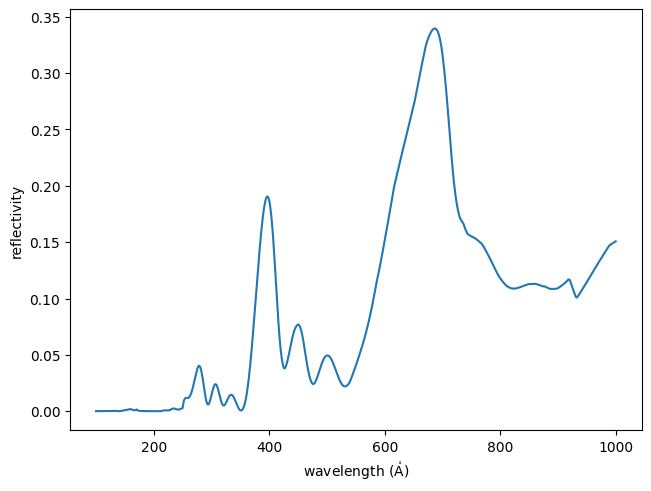
Plot the reflectivity of the coating over the EUV wavelength range.
import matplotlib.pyplot as plt
import astropy.units as u
import astropy.visualization
import named_arrays as na
import optika
from esis.flights.f1.optics import gratings

# Define an array of wavelengths with which to sample the efficiency
wavelength = na.geomspace(100, 1000, axis="wavelength", num=1001) * u.AA

# Define the incident rays from the wavelength array
rays = optika.rays.RayVectorArray(
    wavelength=wavelength,
    direction=na.Cartesian3dVectorArray(0, 0, 1),
)

# Initialize the ESIS diffraction grating material
material = gratings.materials.multilayer_design()

# Compute the reflectivity of the grating multilayer coating
reflectivity = material.efficiency(
    rays=rays,
    normal=na.Cartesian3dVectorArray(0, 0, -1),
)

# Plot the reflectivity vs wavelength
fig, ax = plt.subplots(constrained_layout=True)
na.plt.plot(wavelength, reflectivity, ax=ax);
ax.set_xlabel(f"wavelength ({wavelength.unit:latex_inline})");
ax.set_ylabel("reflectivity");

Plot a diagram of the multilayer stack
with astropy.visualization.quantity_support():
    fig, ax = plt.subplots()
    material.plot_layers(
        ax=ax,
        thickness_substrate=20 * u.nm,
    )
    ax.set_axis_off()

- Return type:

