multilayer_witness_fit#
- esis.flights.f1.optics.primaries.materials.multilayer_witness_fit()#
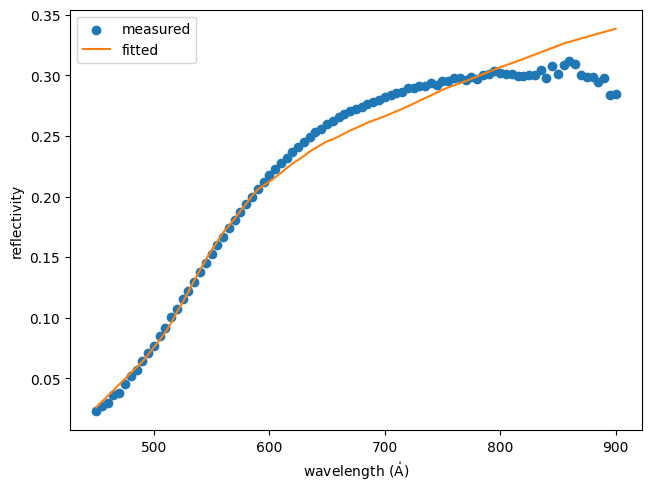
A multilayer stack fitted to the
multilayer_witness_measured()measurement.Examples
Plot the fitted vs. measured reflectivity of the primary mirror witness sample.
import numpy as np
import matplotlib.pyplot as plt
import named_arrays as na
import optika
from esis.flights.f1.optics import primaries

# Load the measured reflectivity of the witness sample
multilayer_measured = primaries.materials.multilayer_witness_measured()
measurement = multilayer_measured.efficiency_measured

# Isolate the angle of incidence of the measurement
angle_incidence = measurement.inputs.direction

# Fit a multilayer stack to the measured reflectivity
multilayer = primaries.materials.multilayer_witness_fit()

# Define the rays incident on the multilayer stack that will be used to
# compute the reflectivity
rays = optika.rays.RayVectorArray(
    wavelength=measurement.inputs.wavelength,
    direction=na.Cartesian3dVectorArray(
        x=np.sin(angle_incidence),
        y=0,
        z=np.cos(angle_incidence),
    ),
)

# Compute the reflectivity of the fitted multilayer stack
reflectivity_fit = multilayer.efficiency(
    rays=rays,
    normal=na.Cartesian3dVectorArray(0, 0, -1),
)

# Plot the fitted vs. measured reflectivity
fig, ax = plt.subplots(constrained_layout=True)
na.plt.scatter(
    measurement.inputs.wavelength,
    measurement.outputs,
    ax=ax,
    label="measured"
);
na.plt.plot(
    rays.wavelength,
    reflectivity_fit,
    ax=ax,
    label="fitted",
    color="tab:orange",
);
ax.set_xlabel(f"wavelength ({rays.wavelength.unit:latex_inline})")
ax.set_ylabel("reflectivity")
ax.legend();

# Print the fitted multilayer stack
multilayer
MultilayerMirror(
    layers=[
        Layer(
            chemical='SiC',
            thickness=21.27827884 nm,
            interface=ErfInterfaceProfile(
                width=3.44068978 nm,
            ),
            kwargs_plot={'color': 'tab:blue', 'alpha': 0.5},
            x_label=None,
        ),
        Layer(
            chemical='Cr',
            thickness=5. nm,
            interface=ErfInterfaceProfile(
                width=1.77840007 nm,
            ),
            kwargs_plot={'color': 'tab:orange', 'alpha': 0.5},
            x_label=None,
        ),
    ],
    substrate=Layer(
        chemical='Si',
        thickness=30. mm,
        interface=ErfInterfaceProfile(
            width=0.92540442 nm,
        ),
        kwargs_plot={'color': 'gray', 'alpha': 0.5},
        x_label=None,
    ),
)
- Return type:

