ruling_measurement#
- esis.flights.f1.optics.gratings.rulings.ruling_measurement(num_distribution=11)#
A model of the rulings where the efficiency has been calculated using the ratio of the total efficiency of the gratings to the efficiency of the multilayer coatings.
The total efficiency of the gratings is given by
esis.flights.f1.optics.gratings.efficiencies.efficiency_vs_wavelength(), and the efficiency of the multilayer coating is given byesis.flights.f1.optics.gratings.materials.multilayer_fit().- Parameters:
num_distribution (int) – The number of Monte Carlo samples to draw when computing uncertainties.
Examples
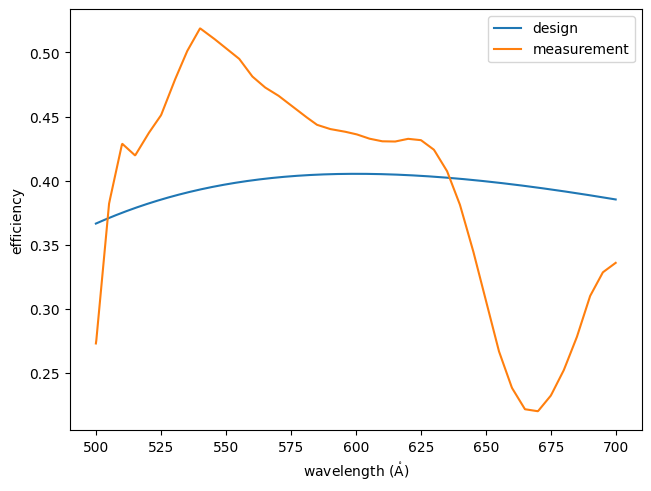
Compare the as-designed efficiency of the rulings to the measured efficiency of the rulings.
import numpy as np
import matplotlib.pyplot as plt
import astropy.units as u
import astropy.visualization
import named_arrays as na
import optika
from esis.flights.f1.optics import gratings

# Define an array of wavelengths with which to sample the efficiency
wavelength = na.geomspace(500, 700, axis="wavelength", num=1001) * u.AA

# Define the incidence angle to be the same as the Horiba technical proposal
angle = 1.3 * u.deg

# Define the incident rays from the wavelength array
rays = optika.rays.RayVectorArray(
    wavelength=wavelength,
    position=0 * u.mm,
    direction=na.Cartesian3dVectorArray(
        x=np.sin(angle),
        y=0,
        z=np.cos(angle),
    ),
)

# Define the surface normal
normal = na.Cartesian3dVectorArray(0, 0, -1)

# Initialize the ESIS diffraction grating ruling model
ruling_design = gratings.rulings.ruling_design(num_distribution=0)
ruling_measurement = gratings.rulings.ruling_measurement(num_distribution=0)

# Compute the efficiency of the grating rulings
efficiency_design = ruling_design.efficiency(
    rays=rays,
    normal=normal,
)
efficiency_measurement = ruling_measurement.efficiency(
    rays=rays,
    normal=normal,
)

# Plot the efficiency vs wavelength
fig, ax = plt.subplots(constrained_layout=True)
na.plt.plot(
    wavelength,
    efficiency_design,
    ax=ax,
    color="tab:blue",
    label="design",
);
na.plt.plot(
    wavelength,
    efficiency_measurement,
    ax=ax,
    color="tab:orange",
    label="measurement",
);
ax.set_xlabel(f"wavelength ({wavelength.unit:latex_inline})");
ax.set_ylabel("efficiency");
ax.legend();