efficiency_vs_x#
- esis.flights.f1.optics.gratings.efficiencies.efficiency_vs_x()#
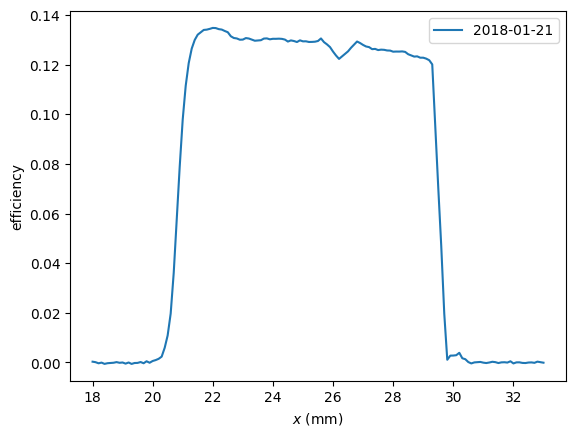
The total (coating + groove) efficiency of the ESIS diffraction gratings as a function of \(x\) position as measured by Eric Gullikson.
Examples
Plot the efficiency vs \(x\) position measurements using matplotlib.
import matplotlib.pyplot as plt
import named_arrays as na
from esis.flights.f1.optics import gratings

# Load the efficiency measurements
efficiency = gratings.efficiencies.efficiency_vs_x()

# Plot the measurements using matplotlib
fig, ax = plt.subplots()
na.plt.plot(
    efficiency.inputs.position,
    efficiency.outputs,
    ax=ax,
    label=efficiency.inputs.time.strftime("%Y-%m-%d"),
);
ax.set_xlabel(f"$x$ ({efficiency.inputs.position.unit:latex_inline})");
ax.set_ylabel(f"efficiency");
ax.legend();
- Return type:
FunctionArray[TemporalSpectralPositionalVectorArray, ScalarArray]